Work / Geotagger: photos, map and 3D
Geotagger: photos, map and 3D
I wrote the geotagger, the QGIS tool where every detection is checked: photos, tie points and elements together on the map, in 3D.
Re-creation. This is a re-creation, not the geotagger. The terrain comes from a public LiDAR tile (ARSO, GKOT TM_426_66, CC BY 4.0), and the coordinates are that tile's, in D96/TM. The photos, dampers, detections, links and the map's styling are simulated or drawn. None of my employer's code, data, imagery or screens is used.
What the real one does
A QGIS tool that ties inspection photos, tie points and elements together on the map, so a person can check every detection in 3D. Two photo windows are linked: a pick in one shows the epipolar line in the other. It is part of the QGIS inspection suite.
- The problem. Detection and matching make thousands of elements, about 30,000 on one project, and a person checks every one before anything goes to the client.
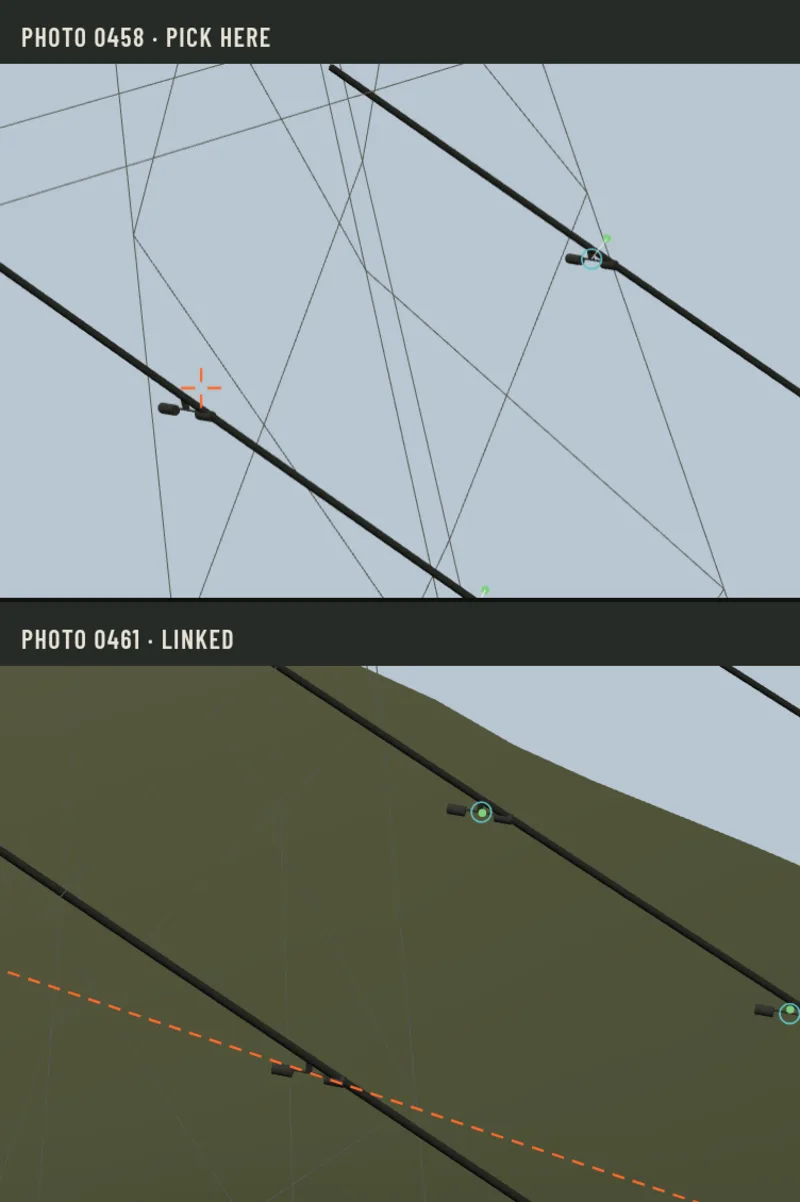
- How it works. Two photo windows sit beside the map. A pick in one shows the epipolar line in the other, where the same point must lie. Tie points are the YOLO detections, and links join each element to the photos that see it.
- New elements. Elements are made automatically, or by hand: pick the element in two photos. The geotagger then finds its other observations and makes the 3D element with all its links. A person can add tie points too.
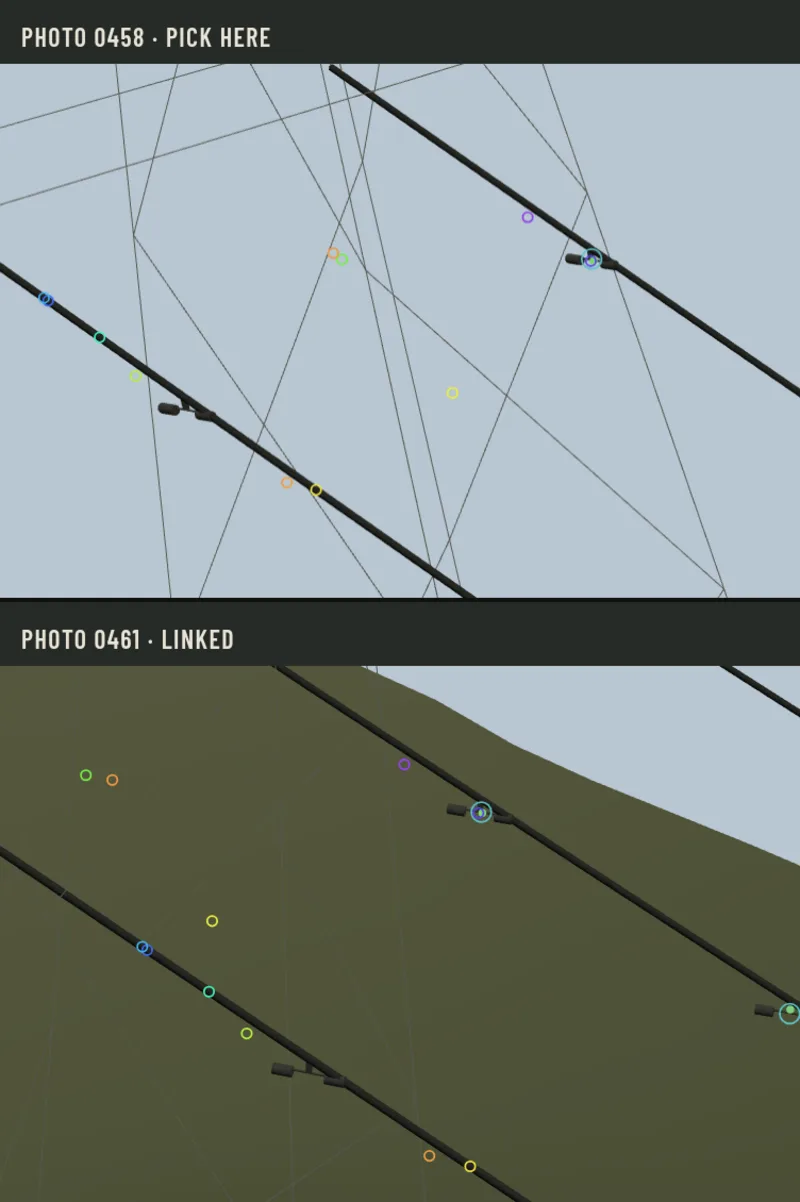
- Alignment and matches. ORB features are matched between the two photos in the background. Aligning the views fits one photo's pose to the other and to its neighbours, with matches along the epipolar band. The new pose is kept only when it fits better, and saving it is a separate step.
- Re-matching. For the elements a photo sees, the geotagger can match the tie points again and realign the photos involved. A count from every photo decides how many elements each cluster gets. It shows the whole plan before anything is written, and logs the old poses so they can be put back.
- My part. All of it, as part of the QGIS suite I maintain.
How the demo works
Open two photos of the span, follow an element between them and the map, and add a damper the detector missed. A short tour plays first; click anywhere in the demo to take over.
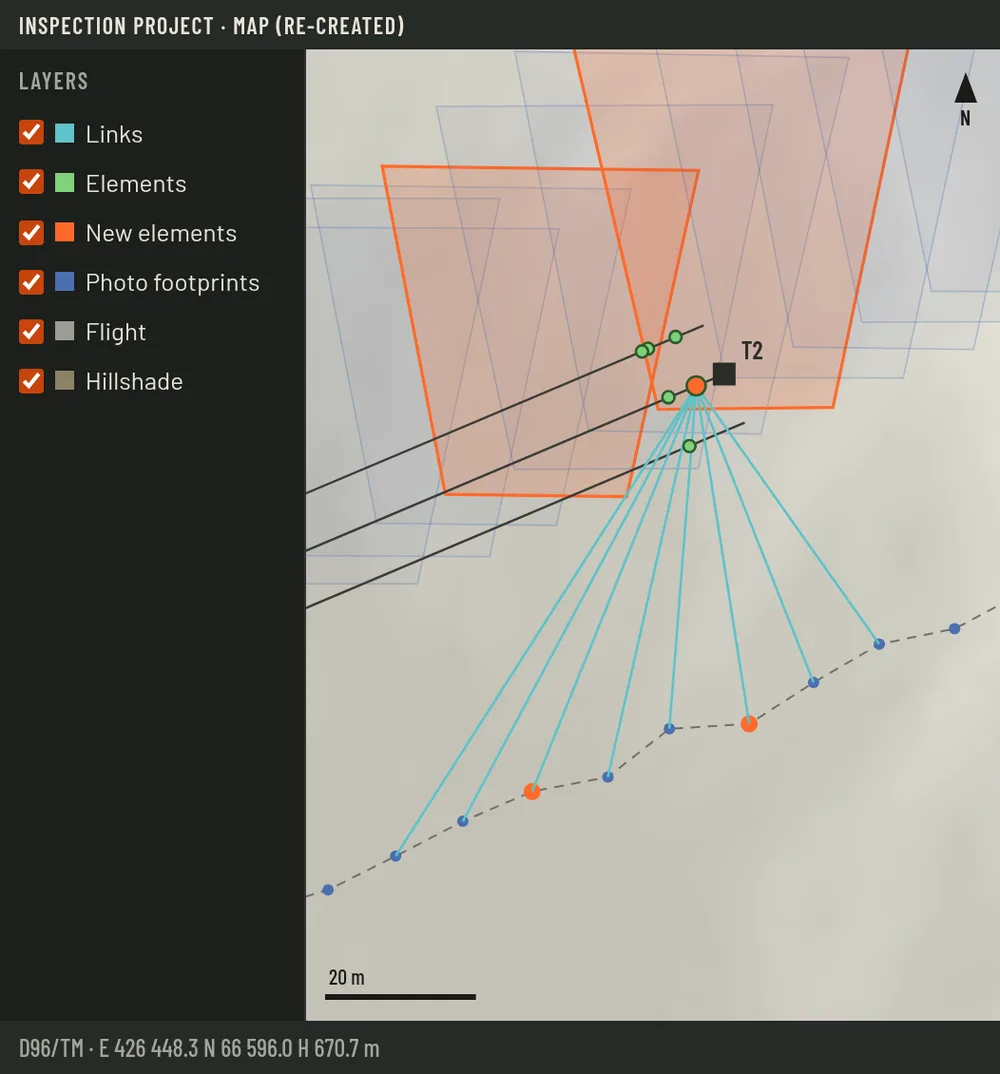
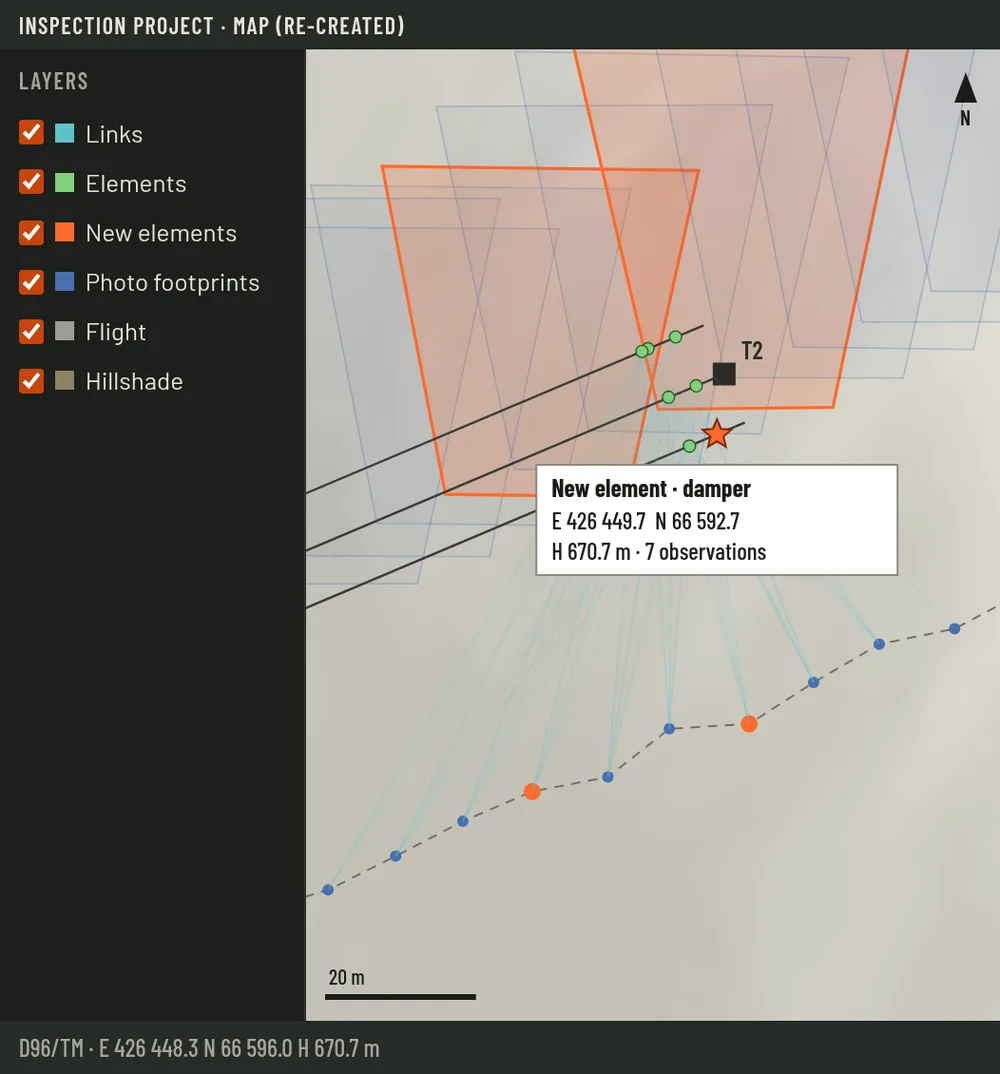
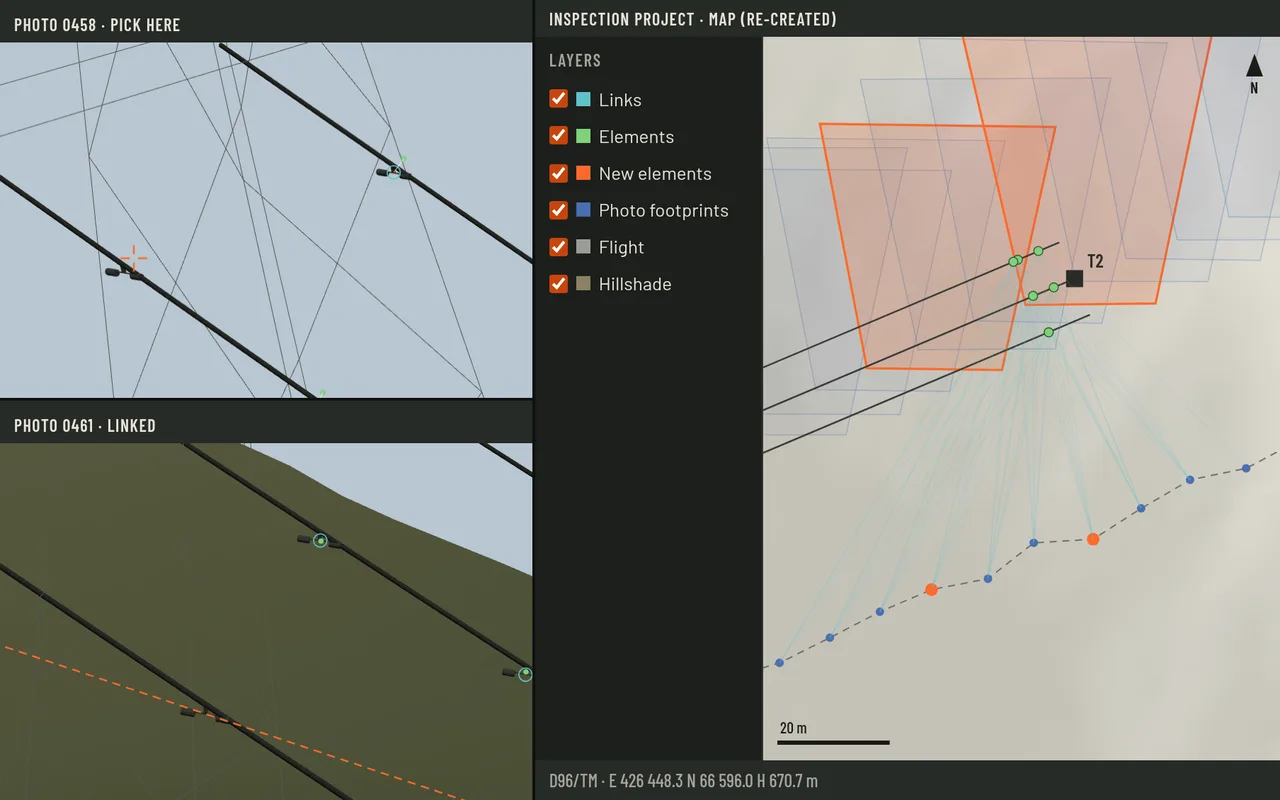
On the right is the span from above, styled like a QGIS map. It shows the flight, a footprint for each photo, the elements, and the links from each element to the photos that see it. Click a photo on the map to open it and a neighbour in the two windows. Hover an element on the map or in a photo, and it lights up in all three.
New element: click a damper in the upper photo. The lower photo draws the epipolar line, on which the same point must lie. Click the damper on that line, and the two rays give its position in 3D. The re-creation then looks for it in every other photo, links each observation and shows its coordinates.
Align views fits the upper photo to the lower one. Every other photo starts with an orientation a little off, so its elements miss their tie points by a few pixels. Aligning turns the photo until they meet, and the new pose is kept because it fits better. Matches marks feature points found in both photos.
The stills below show the same steps, for readers without JavaScript.